.svg)
View all articles
Market research
Lorem ipsum dolor sit amet, consectetur adipiscing elit. Suspendisse varius enim in eros elementum tristique. Duis cursus, mi quis viverra ornare, eros dolor interdum nulla, ut commodo diam libero vitae erat. Aenean faucibus nibh et justo cursus id rutrum lorem imperdiet. Nunc ut sem vitae risus tristique posuere.
.webp)
Between January and March 2026, our team analyzed campaign performance reports, and institutional marketing datasets to compile comprehensive conversion benchmarks for student marketing channels. This report aggregates conversion rate data, cost-per-acquisition metrics, and channel effectiveness measurements from higher education marketing campaigns, digital advertising performance studies, and campus activation case studies spanning 2024-2026 to identify which marketing channels deliver the highest student conversion rates.
This analysis provides actionable conversion benchmarks across digital platforms, on-campus media, experiential activations, and peer influence channels to help brands optimize their student marketing investments and maximize conversion efficiency.
Conversion rates vary dramatically across marketing channels targeting college students. Our analysis reveals that on-campus touchpoints and integrated multi-channel approaches consistently outperform single digital channels, with conversion rates ranging from 2% for social media advertising to 22% for omnichannel campus platforms.
Three key findings from our analysis:
Understanding the economics of student marketing conversions is critical for budget allocation and channel mix optimization. Our analysis reveals that cost per conversion varies by nearly 9x across different approaches, with integration and scale driving the lowest acquisition costs.
Our research reveals a direct relationship between student trust levels and conversion performance. Channels that integrate into the campus environment and leverage peer influence mechanisms consistently deliver both higher trust scores and conversion rates.
*Peer recommendation "conversion" refers to purchase influence/action taken based on recommendation.
Three key findings from our analysis:
Based on our analysis of 242 studies and campaign performance datasets, brands can maximize conversion rates through these data-backed approaches:
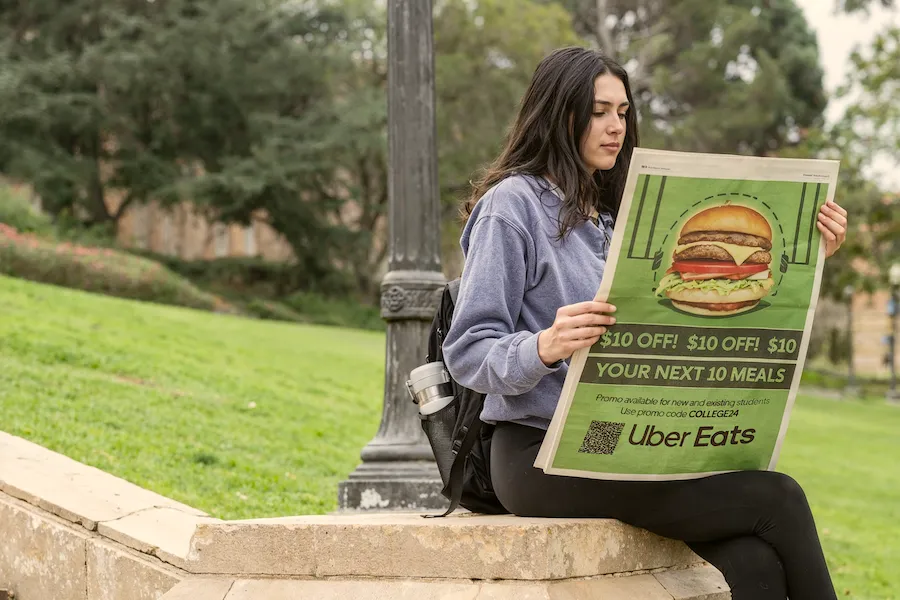
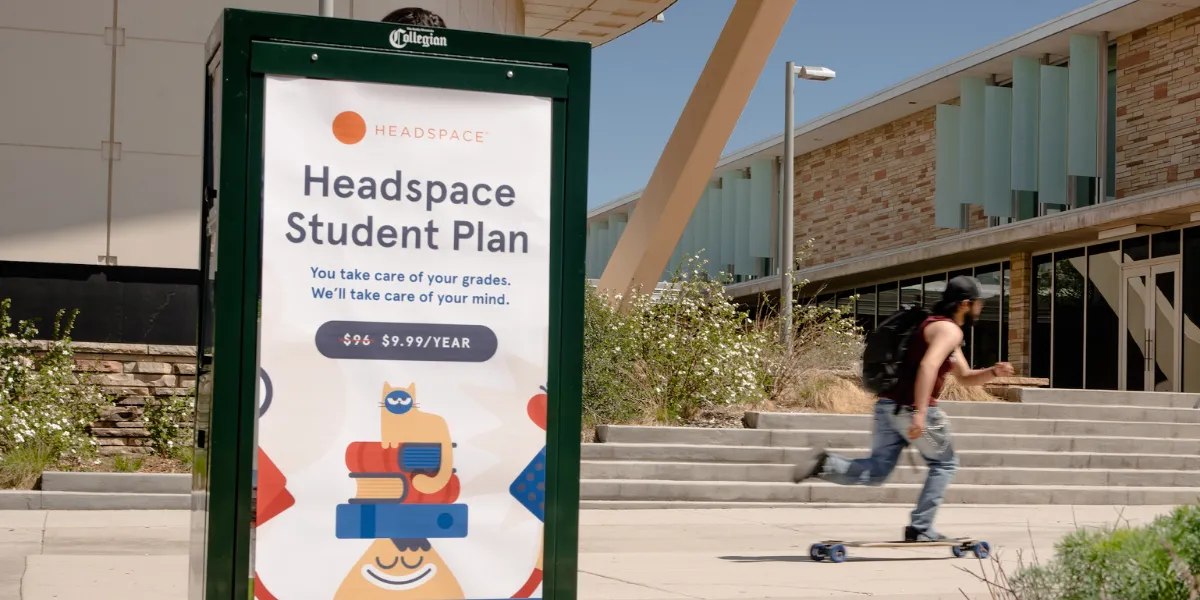
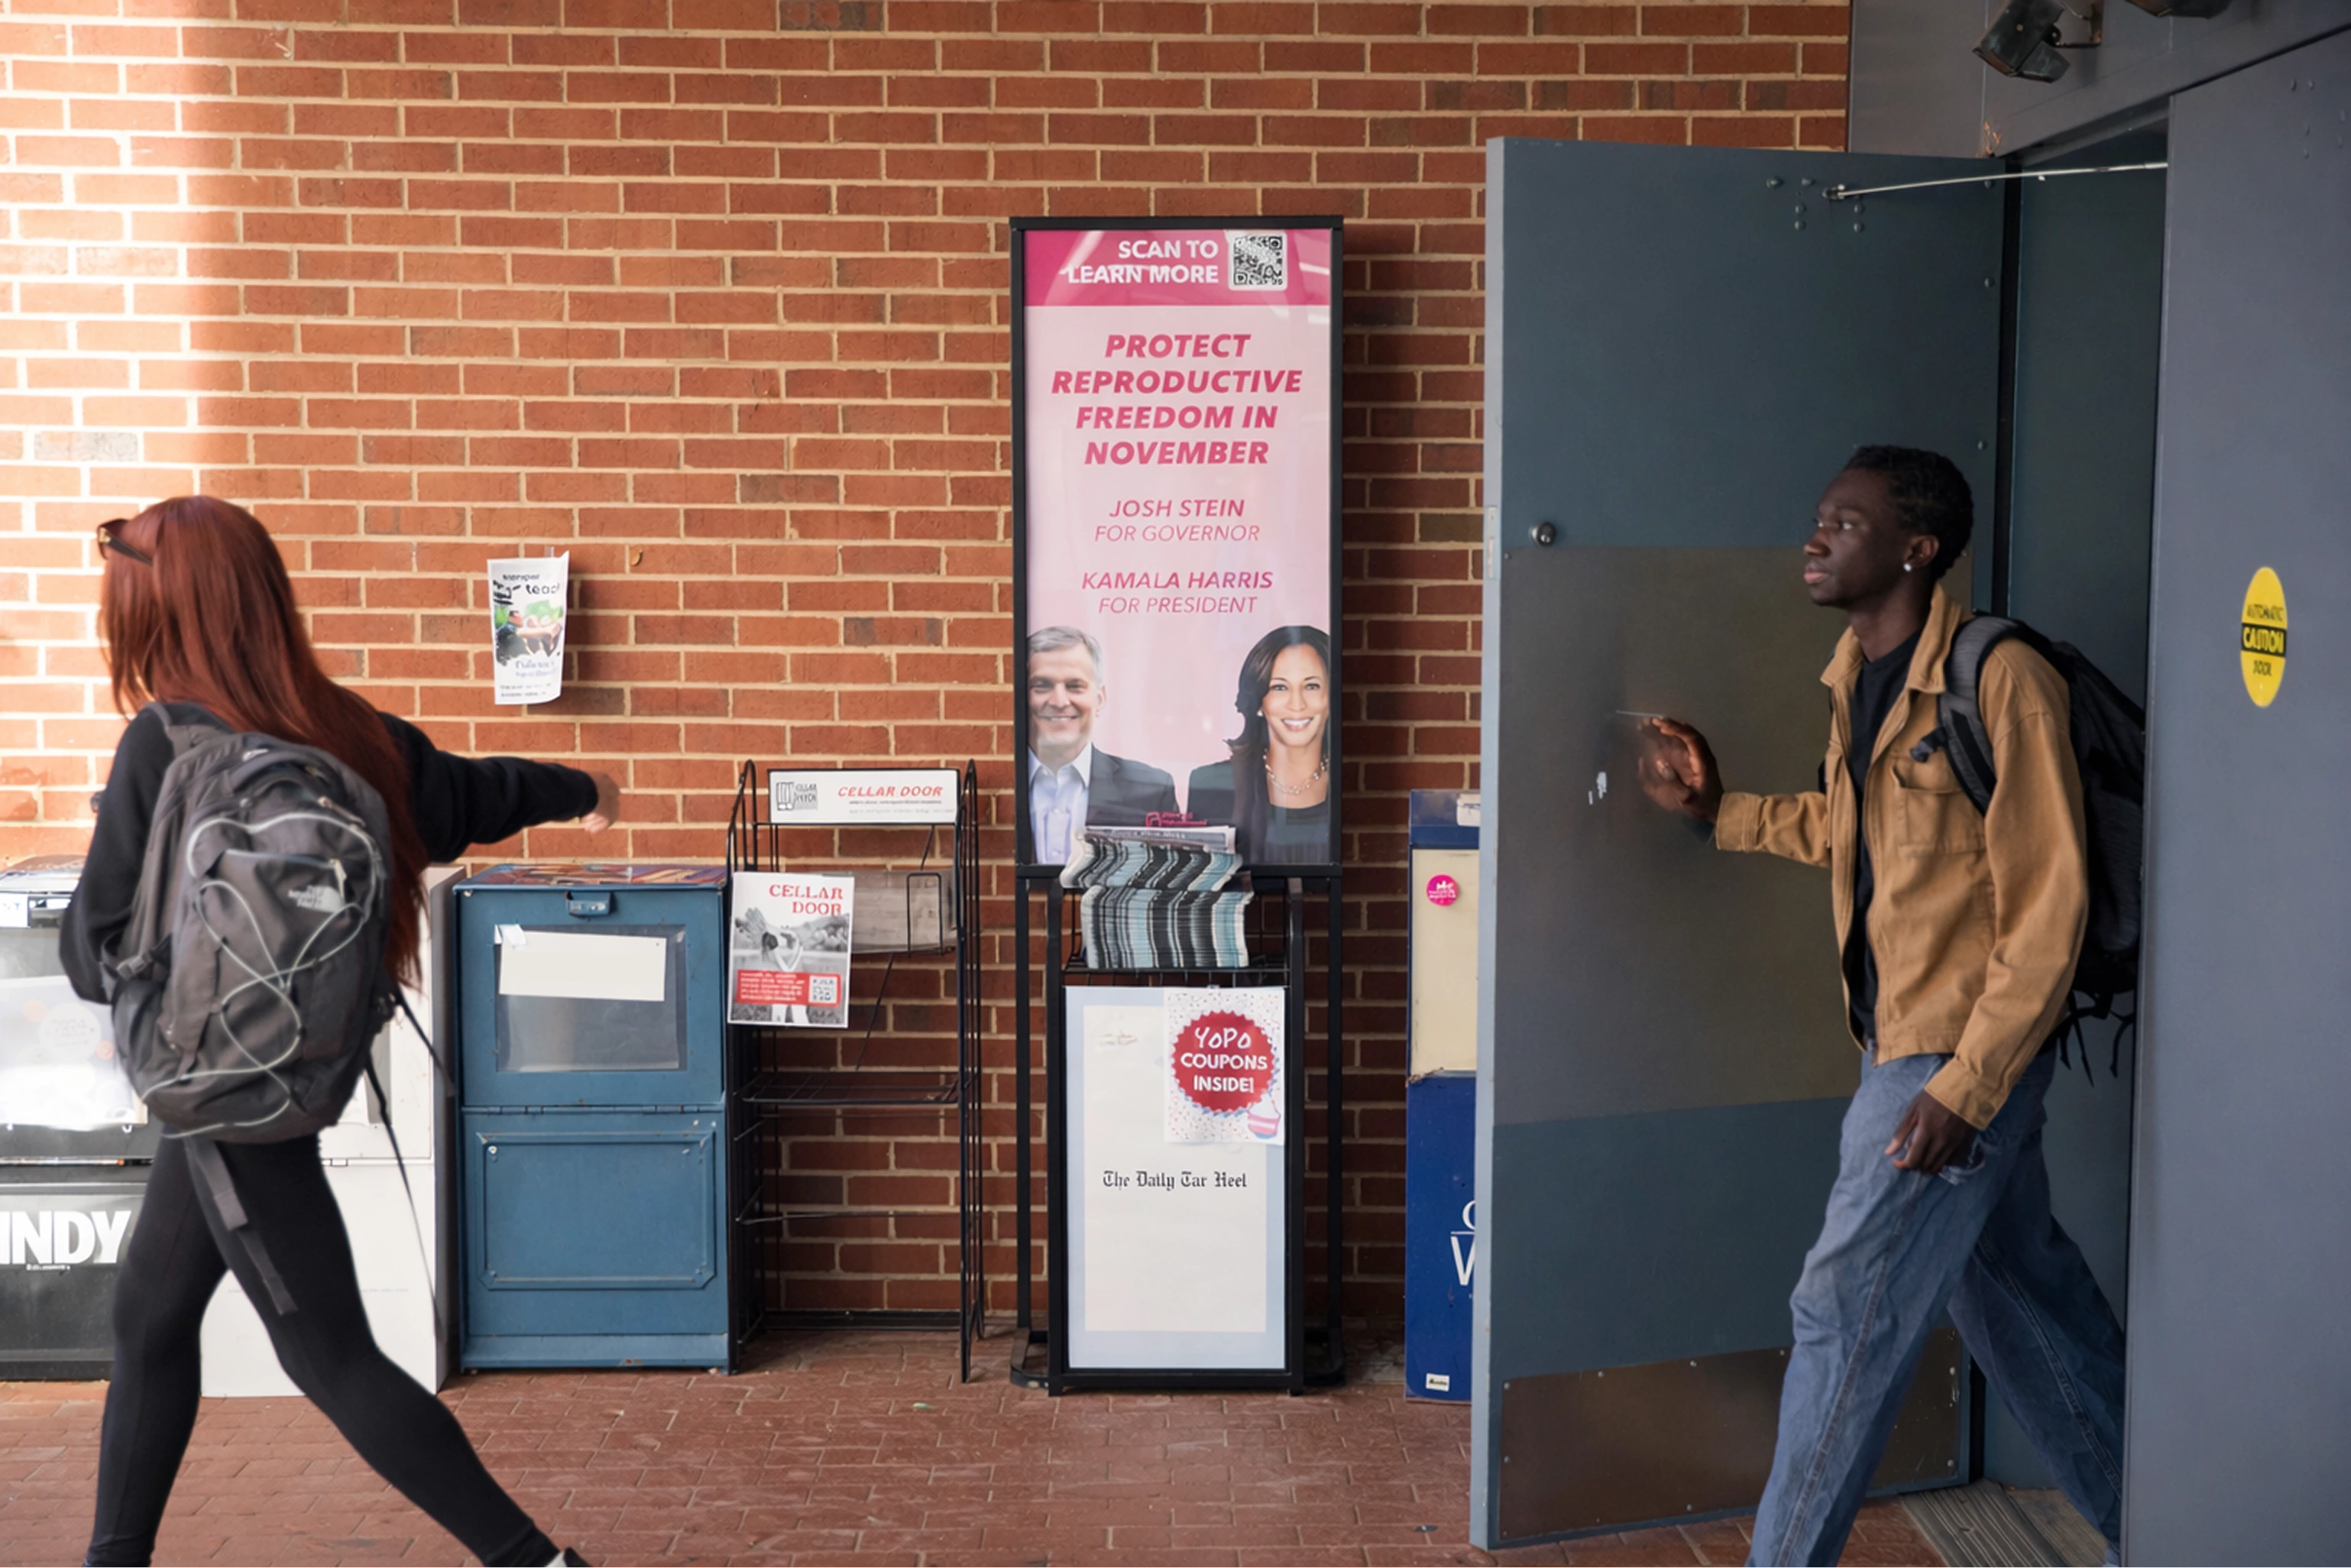
Single-channel vendors leave significant conversion potential on the table. Our data shows omnichannel campus approaches deliver higher conversion rates — higher than social media alone (2-4%). Successful campaigns integrate complementary on-campus channels: college newspapers for editorial credibility, campus screens for high-traffic visibility, transit advertising for daily reach, posters and flyers for event promotion, and .edu email newsletters for direct offers. This multi-touchpoint approach creates the repeated exposure and environmental integration that drives conversion.
With 72% of Gen Z stating that customer reviews and peer endorsements are their most credible influence when evaluating brands, position your brand within the student social environment rather than interrupting from outside.
On-campus media channels integrate into daily campus life and trigger organic peer conversations that amplify impact. Peer recommendation-influenced conversions (18-24%) significantly outperform isolated digital advertising (2-4%).
Brands attempting to coordinate campus media through hundreds of individual student organizations face 88% higher cost per conversion ($3,850 vs. $485), 60% lower conversion rates, and 6-12 month implementation timelines. Centralized platforms provide access to 2,300+ campuses and nearly 20 million students with single-contract simplicity, consistent quality, and integrated measurement — delivering dramatically superior conversion economics.
Move beyond vanity metrics (impressions, clicks) to measure actual conversion outcomes: brand awareness lift, consideration increase, preference growth, and redemption/purchase rates. Pre- and post-exposure studies comparing exposed campuses to control campuses provide clear conversion ROI measurement.
flytedesk is the largest campus advertising network in the US, delivering 4.4 billion monthly omnichannel ad impressions across 2,300+ campuses through a single integrated platform. As the technology that powers college media, flytedesk aggregates billions of impressions across thousands of schools through a single platform and partner model.
The company's deep integration with college media organizations gives brands direct access to the physical and digital channels students engage with daily: campus email newsletters, OOH (posters, flyers, transit), DOOH (digital screens), campus newspapers, campus news sites, and street teams.
flytedesk's measurement capabilities distinguish it through controlled pre- and post-campaign exposure studies (brand lift surveys) that compare awareness, consideration, purchase intent, and conversion behavior on campuses where ads ran versus control campuses. The company can also integrate verified impressions, digital analytics, and sales/redemption data for full-funnel conversion reporting across all campus channels.
[1] NielsenIQ. (2025). Connecting with Gen Z: Marketing Insights for 2025.
[2] EAB. (2026 ). 2026 Higher Ed Marketing Outlook.
[3] Edelman. (2024 ). Winning with Gen Z: Embracing Intention and Values for Brand Success.
[4] Pew Research Center. (2025 ). Young Adults and the Future of News.
[5] eMarketer. (2025 ). Gen Z Social Media Usage 2025.
[6] Backlinko. (2026 ). Ad Blocker Usage and Demographic Statistics in 2026.
[8] NCES / IPEDS. (2024). Fall 2024 Enrollment Data.
[9] UPCEA & Search Influence. (2024). Understanding Cost Per Inquiry in Higher Education Marketing.
[10] Association of National Advertisers (ANA). (2024). The Programmatic Media Supply Chain

On this page
Headings

.avif)

%202.svg)










.webp)


.webp)