.svg)
View all articles
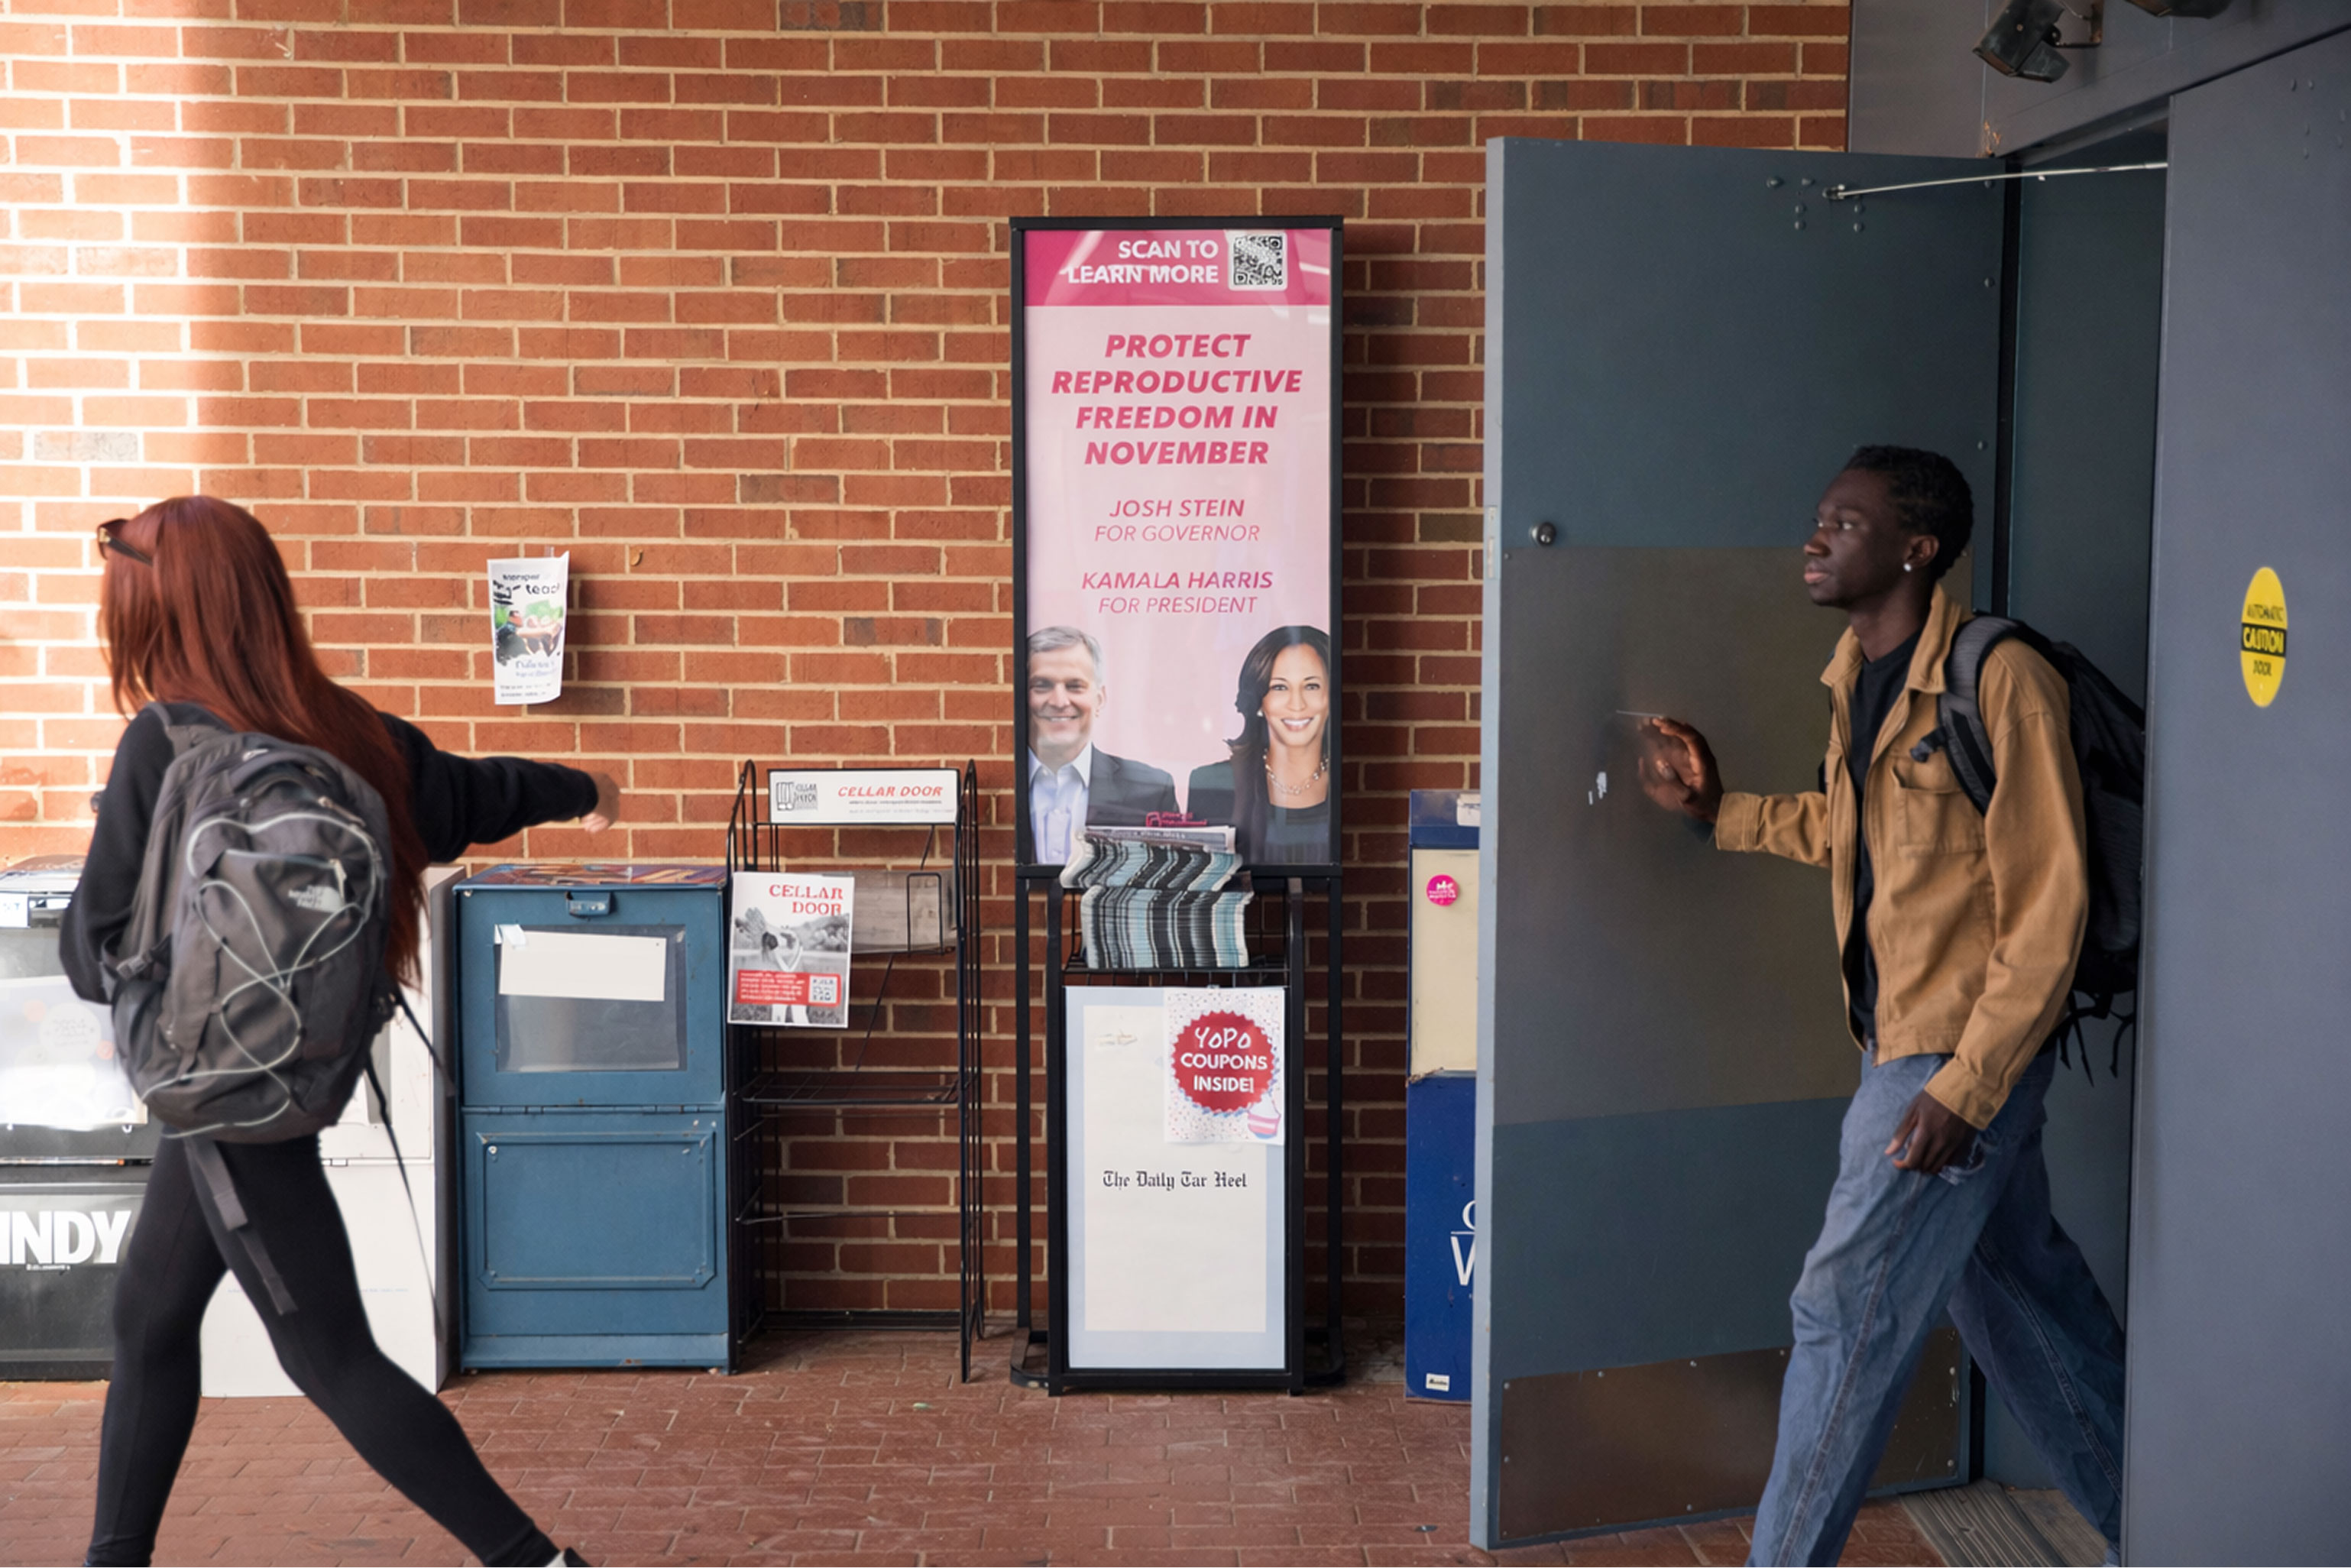
Student behavior
A nationwide study of over 3,000 college students reveals how peer perception drives brand decisions on campus — and how campus media shapes those perceptions.
June 12, 2026
Lorem ipsum dolor sit amet, consectetur adipiscing elit. Suspendisse varius enim in eros elementum tristique. Duis cursus, mi quis viverra ornare, eros dolor interdum nulla, ut commodo diam libero vitae erat. Aenean faucibus nibh et justo cursus id rutrum lorem imperdiet. Nunc ut sem vitae risus tristique posuere.
.jpg)
Back-to-college spending reached $88.8 billion in 2025. Per-student spending has more than doubled since 2008, rising at more than twice the pace of general inflation. By any measure, this is one of the most significant consumer spending events of the year, and one of the least well understood.
The College 2026 report is an attempt to fix that.
The conventional summer shopping season is only part of the picture. Survey findings reveal three distinct purchase windows: before campus arrival (electronics, bedding), move-in weekend (groceries, essentials), and post-arrival (textbooks, software, personal care).
A campaign timed only to summer is absent during the windows when some of the highest-volume, highest-frequency categories are being purchased — and when brand habits are still forming.
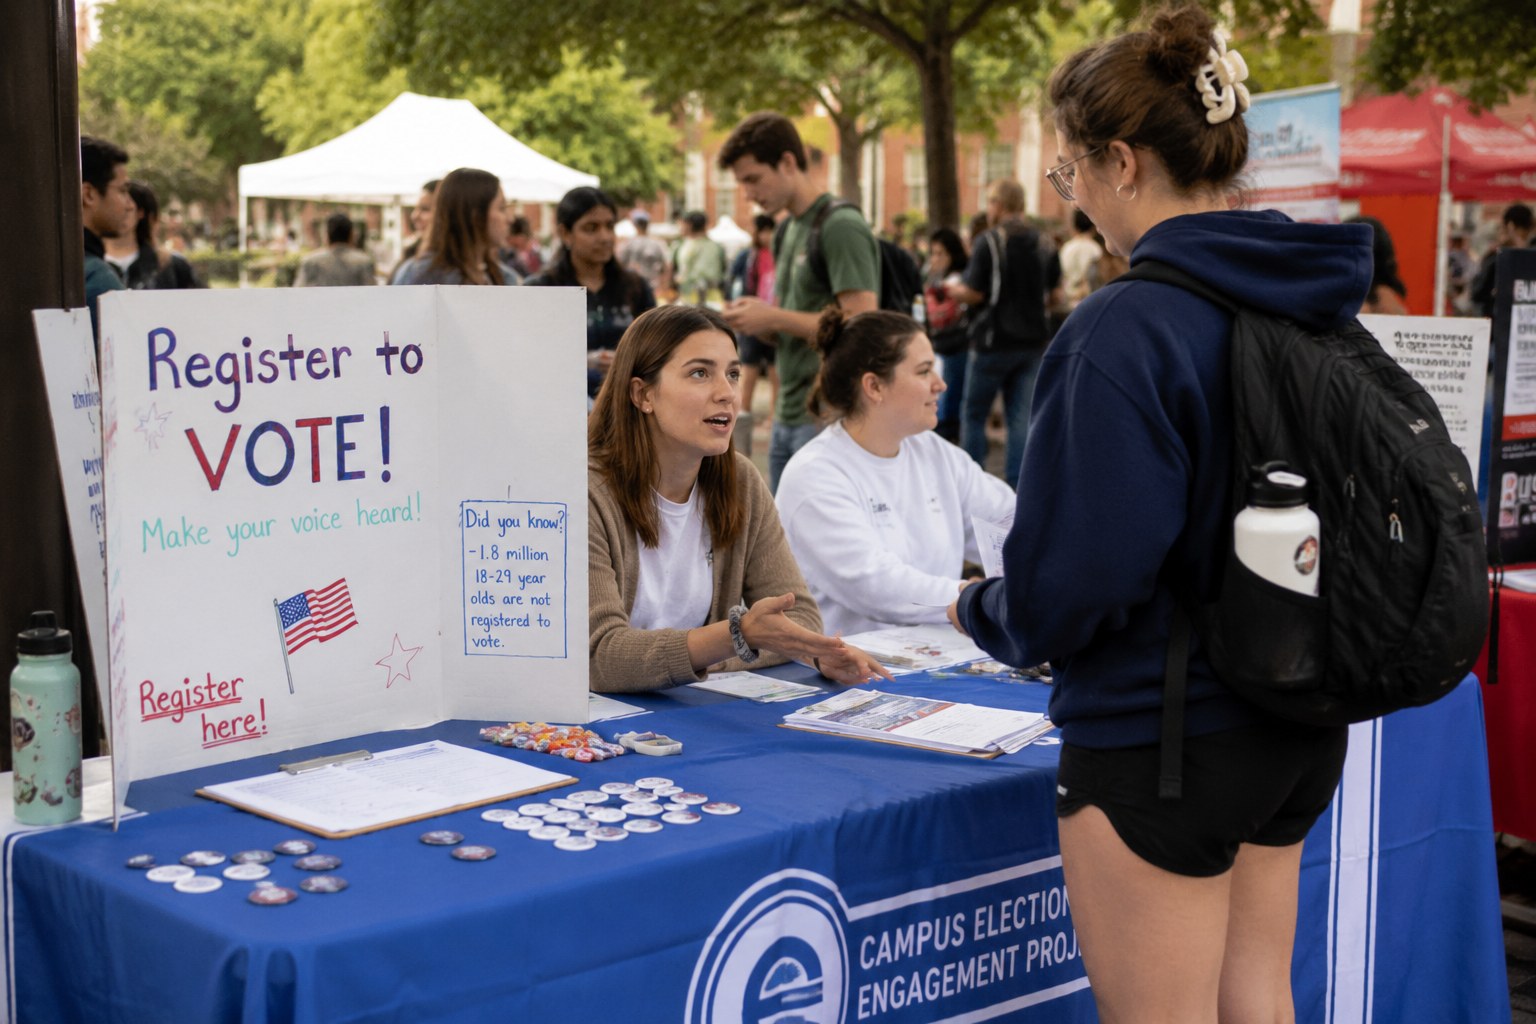
82% of college students trust peer recommendations over advertising. But the mechanism goes deeper than word-of-mouth. Perceived popularity — what students believe their peers are doing — is a measurable purchase driver.
Students are up to 2.6 times more likely to buy the brands they perceive as dominant on campus.
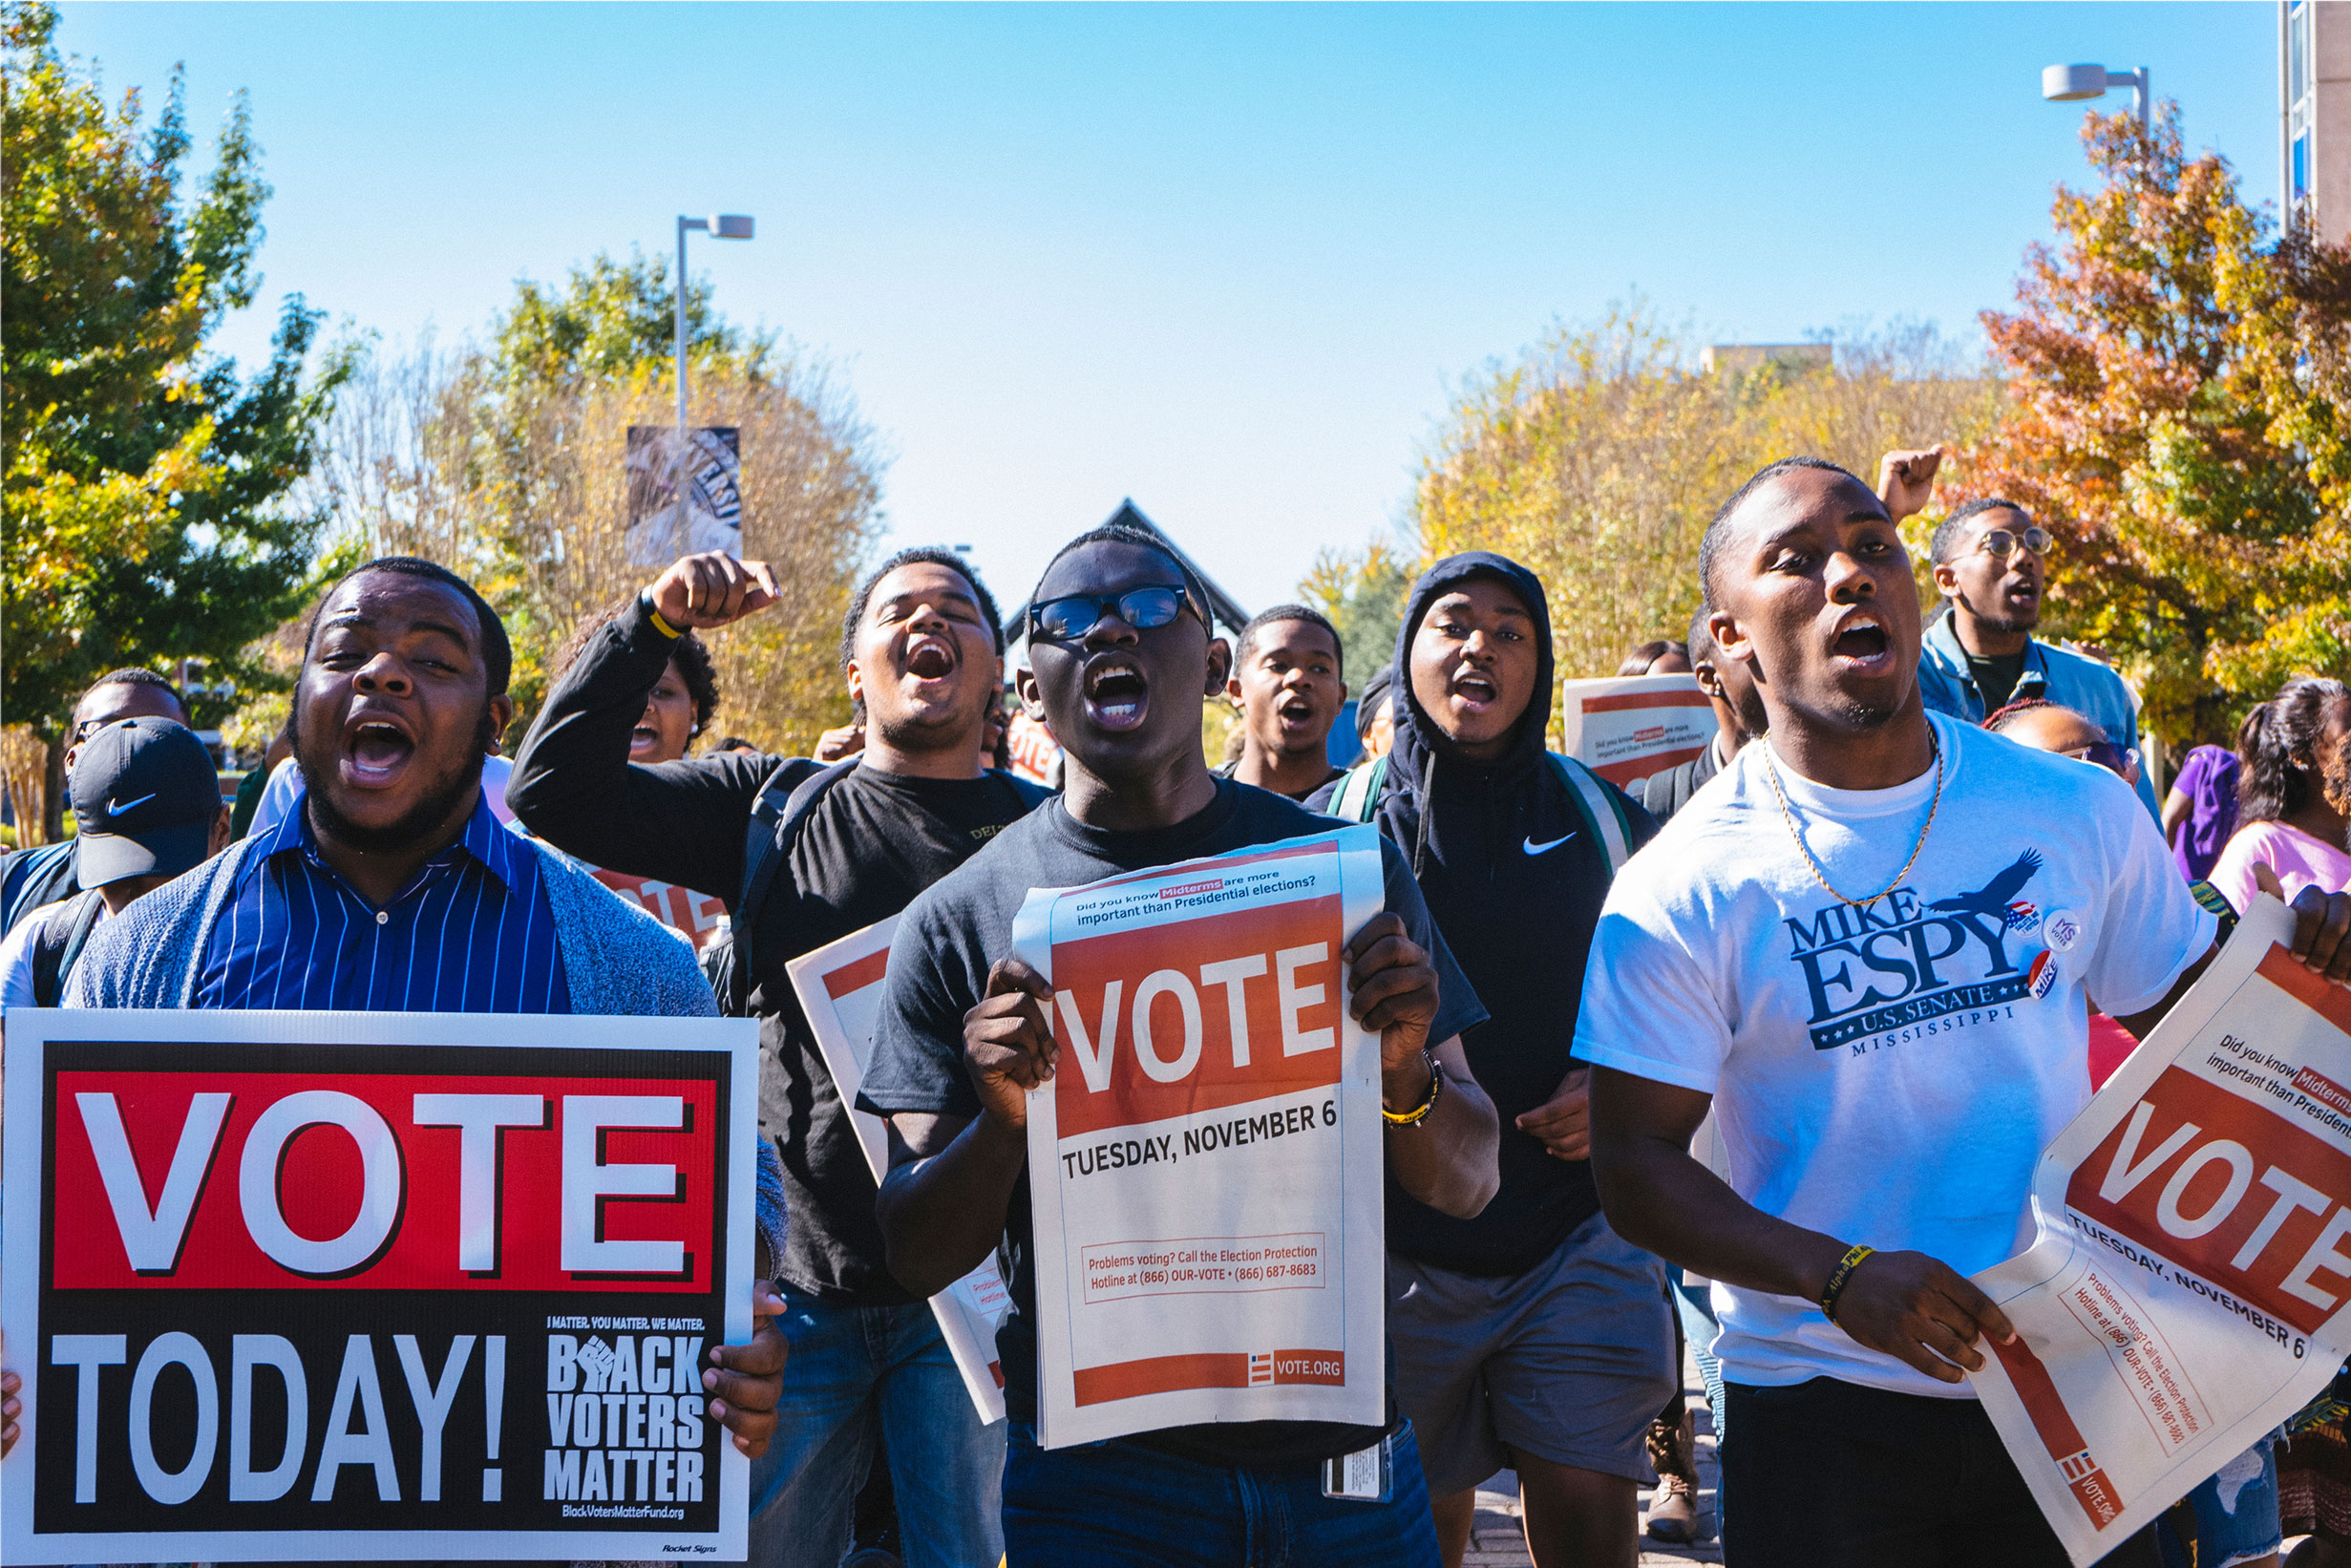
In a flytedesk matched-market experiment, students on campuses with high-intensity exposure to campus media showed the strongest belief that peers were using the platform — and the strongest actual usage.
Product usage on high-intensity campuses was 5 times greater than student cohorts that were exposed to digital advertising alone:
Campus media shapes what students believe their peers are doing, which shapes what students do.
Findings are based on two surveys conducted by flytedesk in April 2026. The primary survey collected 1,536 completed responses from college students across the United States. The shelf simulator survey collected 1,346 completed responses from a separate student sample. Both were weighted by gender and race/ethnicity to align with national enrollment data.
College 2026 covers the complete back-to-college market, a detailed portrait of the 2026 student, the matched-market experiment in full, and how leading brands have applied these findings on campus to create winning back-to-college campaigns.
Click here to access the full report.
For more findings from flytedesk's ongoing student research program, see the college student statistics library.

On this page
Headings
.avif)

%202.svg)