View all articles

Back-to-school

The $88.8B economics of back-to-college

Back-to-college spending reached $88.8 billion in 2025, but it doesn't happen all at once. flytedesk data shows three distinct buying windows, and a summer-only campaign misses two out of three.

The $88.8B economics of back-to-college

Back-to-college spending reached $88.8 billion in 2025, up from $86.6 billion in 2024 and roughly $67.7 billion in 2020. Per-student spending has risen from $599 in 2008 to $1,326 in 2025, more than double the pace of inflation (National Retail Federation, Back-to-College Data Center, 2025).

The increase reflects the expanding scope of what students now consider college essentials. New categories have entered the mix, like streaming subscriptions and software and digital tools, that would not have appeared on a back-to-college list a decade ago.
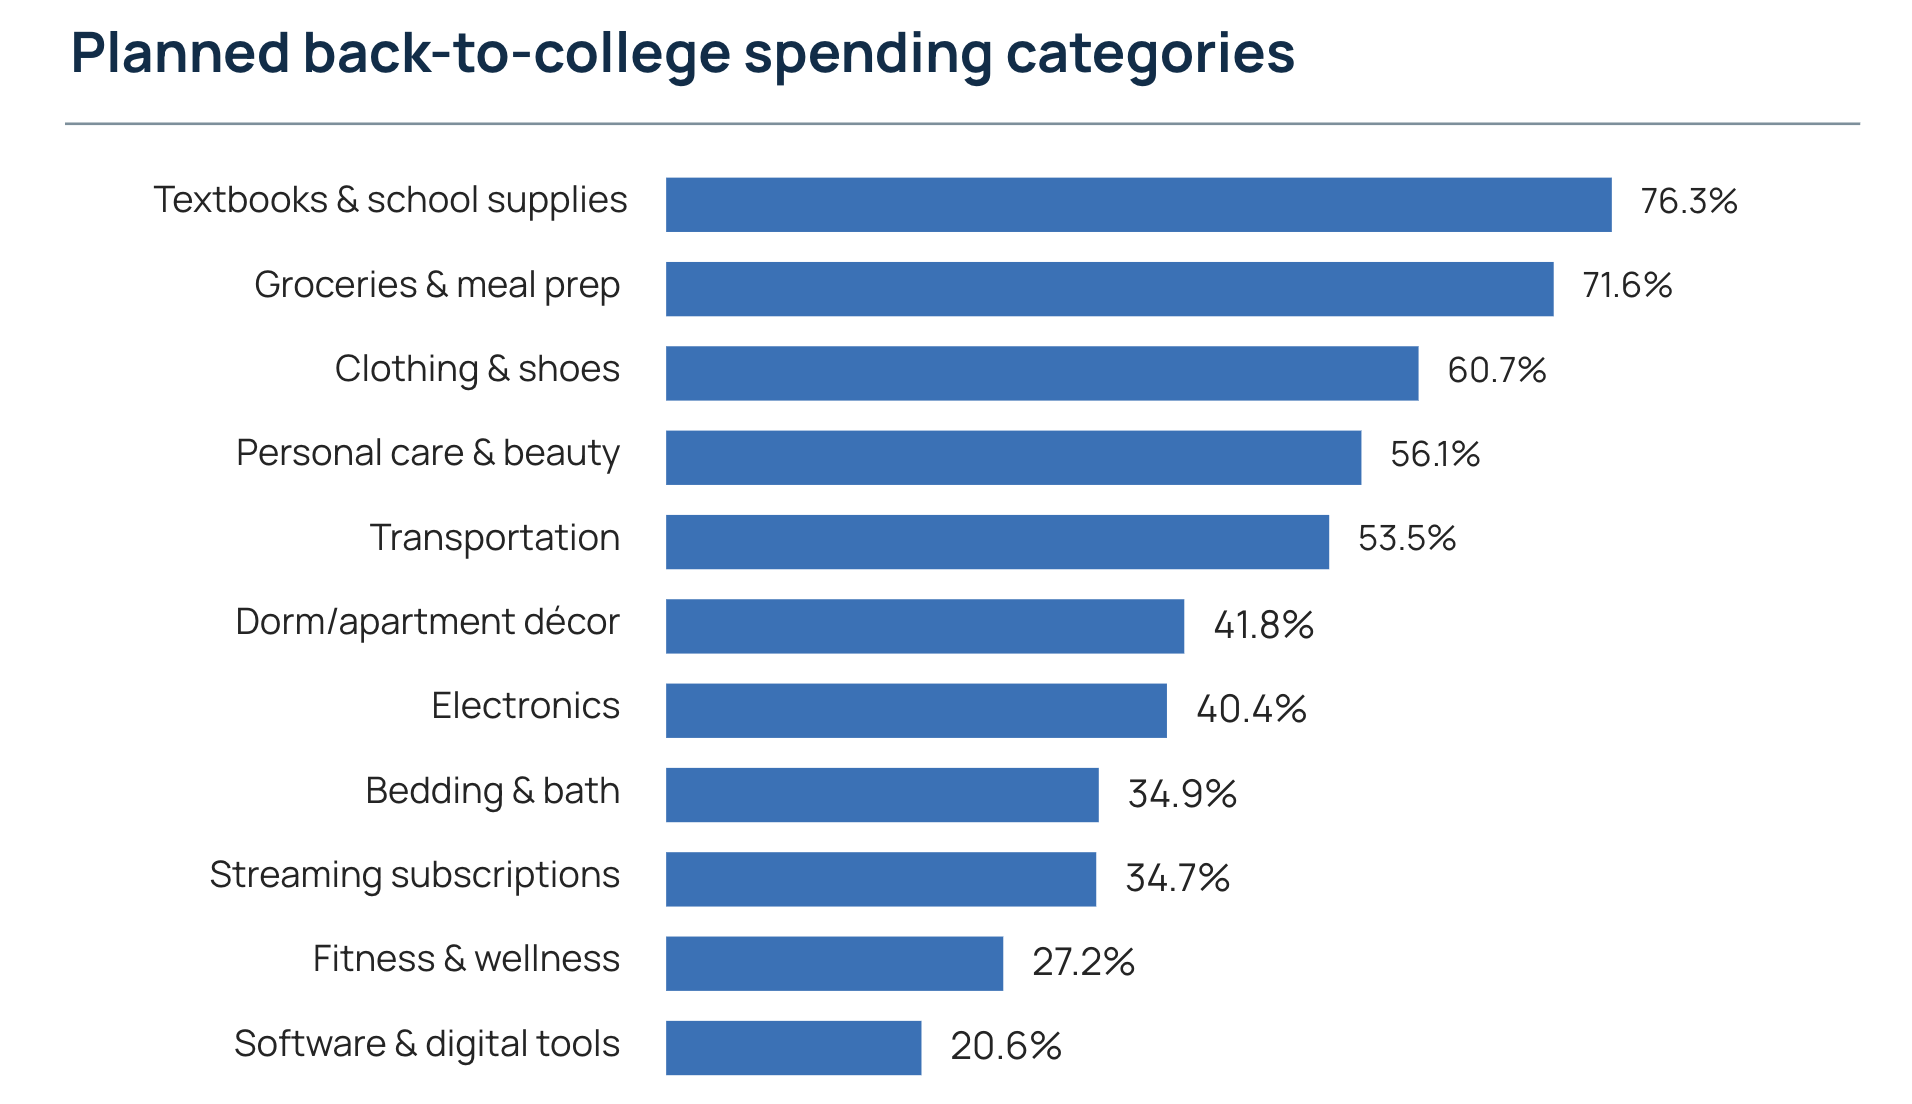
Bar chart titled "Planned back-to-college spending categories," showing the share of students planning to spend in each category: textbooks and school supplies 76.3%, groceries and meal prep 71.6%, clothing and shoes 60.7%, personal care and beauty 56.1%, transportation 53.5%, dorm and apartment décor 41.8%, electronics 40.4%, bedding and bath 34.9%, streaming subscriptions 34.7%, fitness and wellness 27.2%, and software and digital tools 20.6%.
source: flytedesk student research, 2026

Three back-to-college buying windows, not one

The conventional summer shopping season is only part of the picture. flytedesk research reveals three distinct purchase windows: before campus arrival (electronics, bedding), move-in weekend (groceries, essentials), and post-arrival (textbooks, software, personal care).
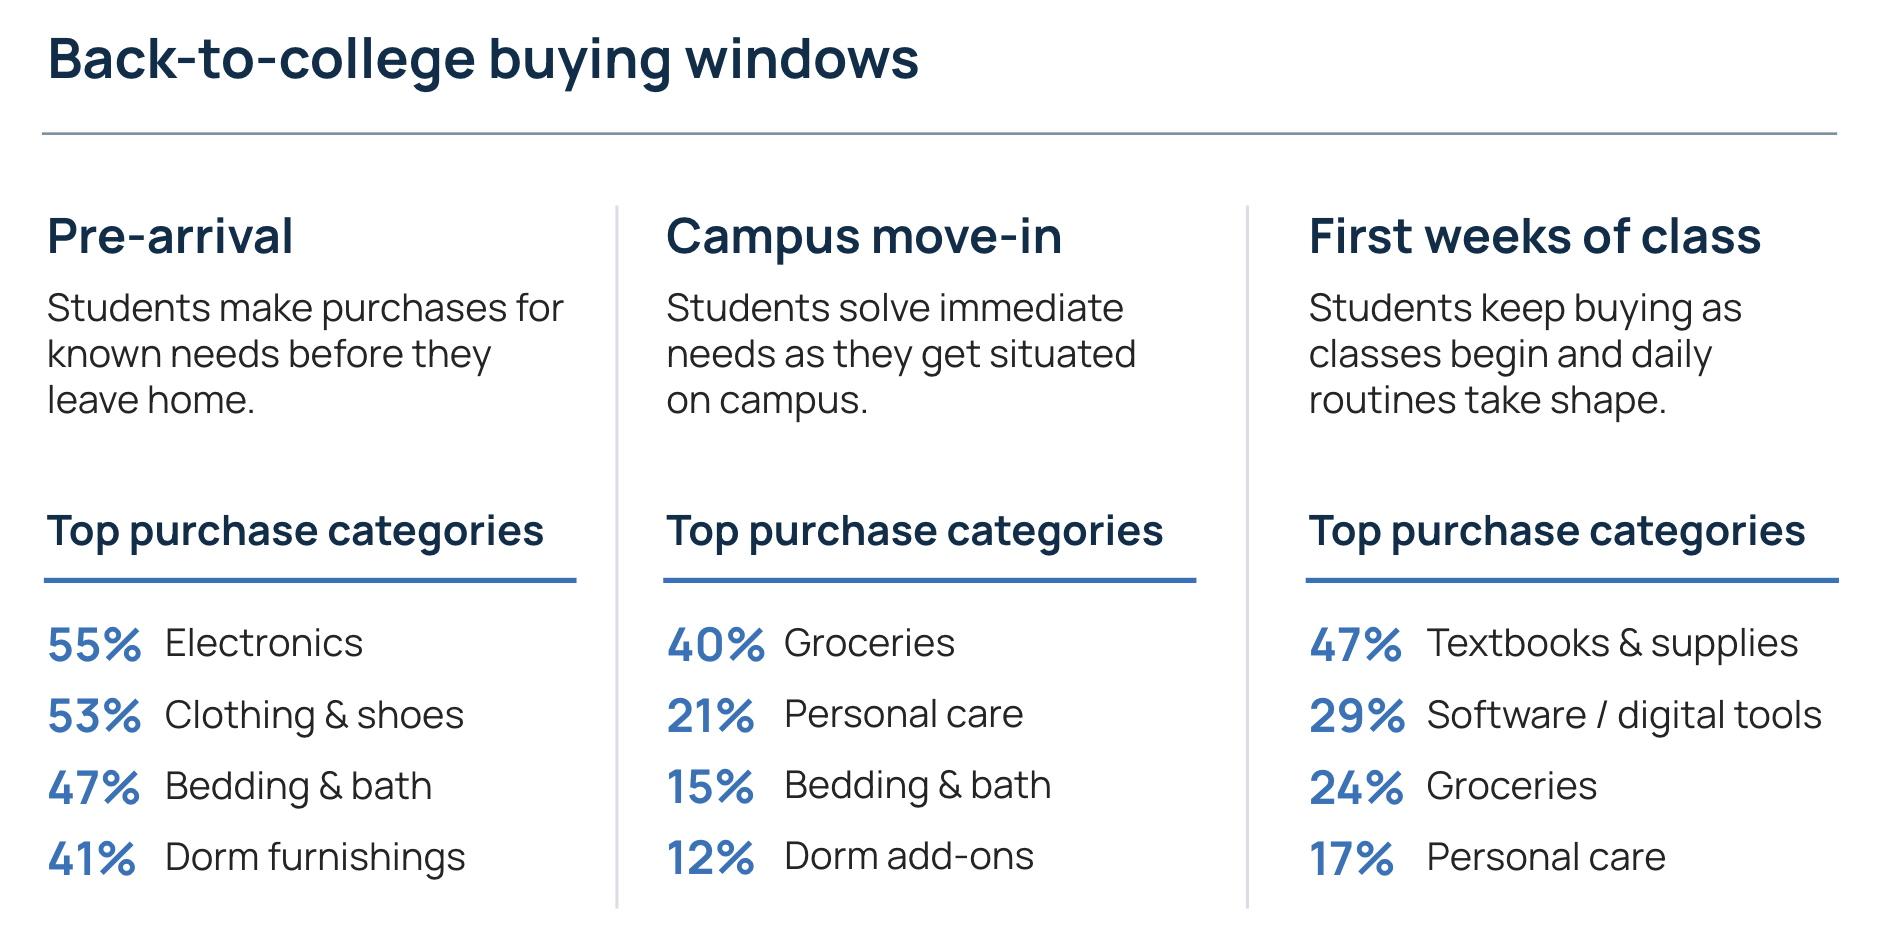
Three-column graphic titled "Back-to-college buying windows." Pre-arrival: students make purchases for known needs before they leave home; top categories are electronics 55%, clothing and shoes 53%, bedding and bath 47%, and dorm furnishings 41%. Campus move-in: students solve immediate needs as they get situated on campus; top categories are groceries 40%, personal care 21%, bedding and bath 15%, and dorm add-ons 12%. First weeks of class: students keep buying as classes begin and daily routines take shape; top categories are textbooks and supplies 47%, software and digital tools 29%, groceries 24%, and personal care 17%.
source: flytedesk student research, 2026

The post-arrival window is especially active and often underestimated. flytedesk research among incoming first-year students found that 99% make a trip for core back-to-school items like groceries, personal care products, and school supplies after move-in, not before.

99% of students buy core back-to-school items like groceries, personal care products, and school supplies after move-in.

Where back-to-college spending happens

Students' go-to retailers are practical and high-convenience. Amazon leads by a wide margin, named among the top three back-to-college shopping destinations by 72.8% of students, followed by Walmart at 56% and Target at 31.7%.
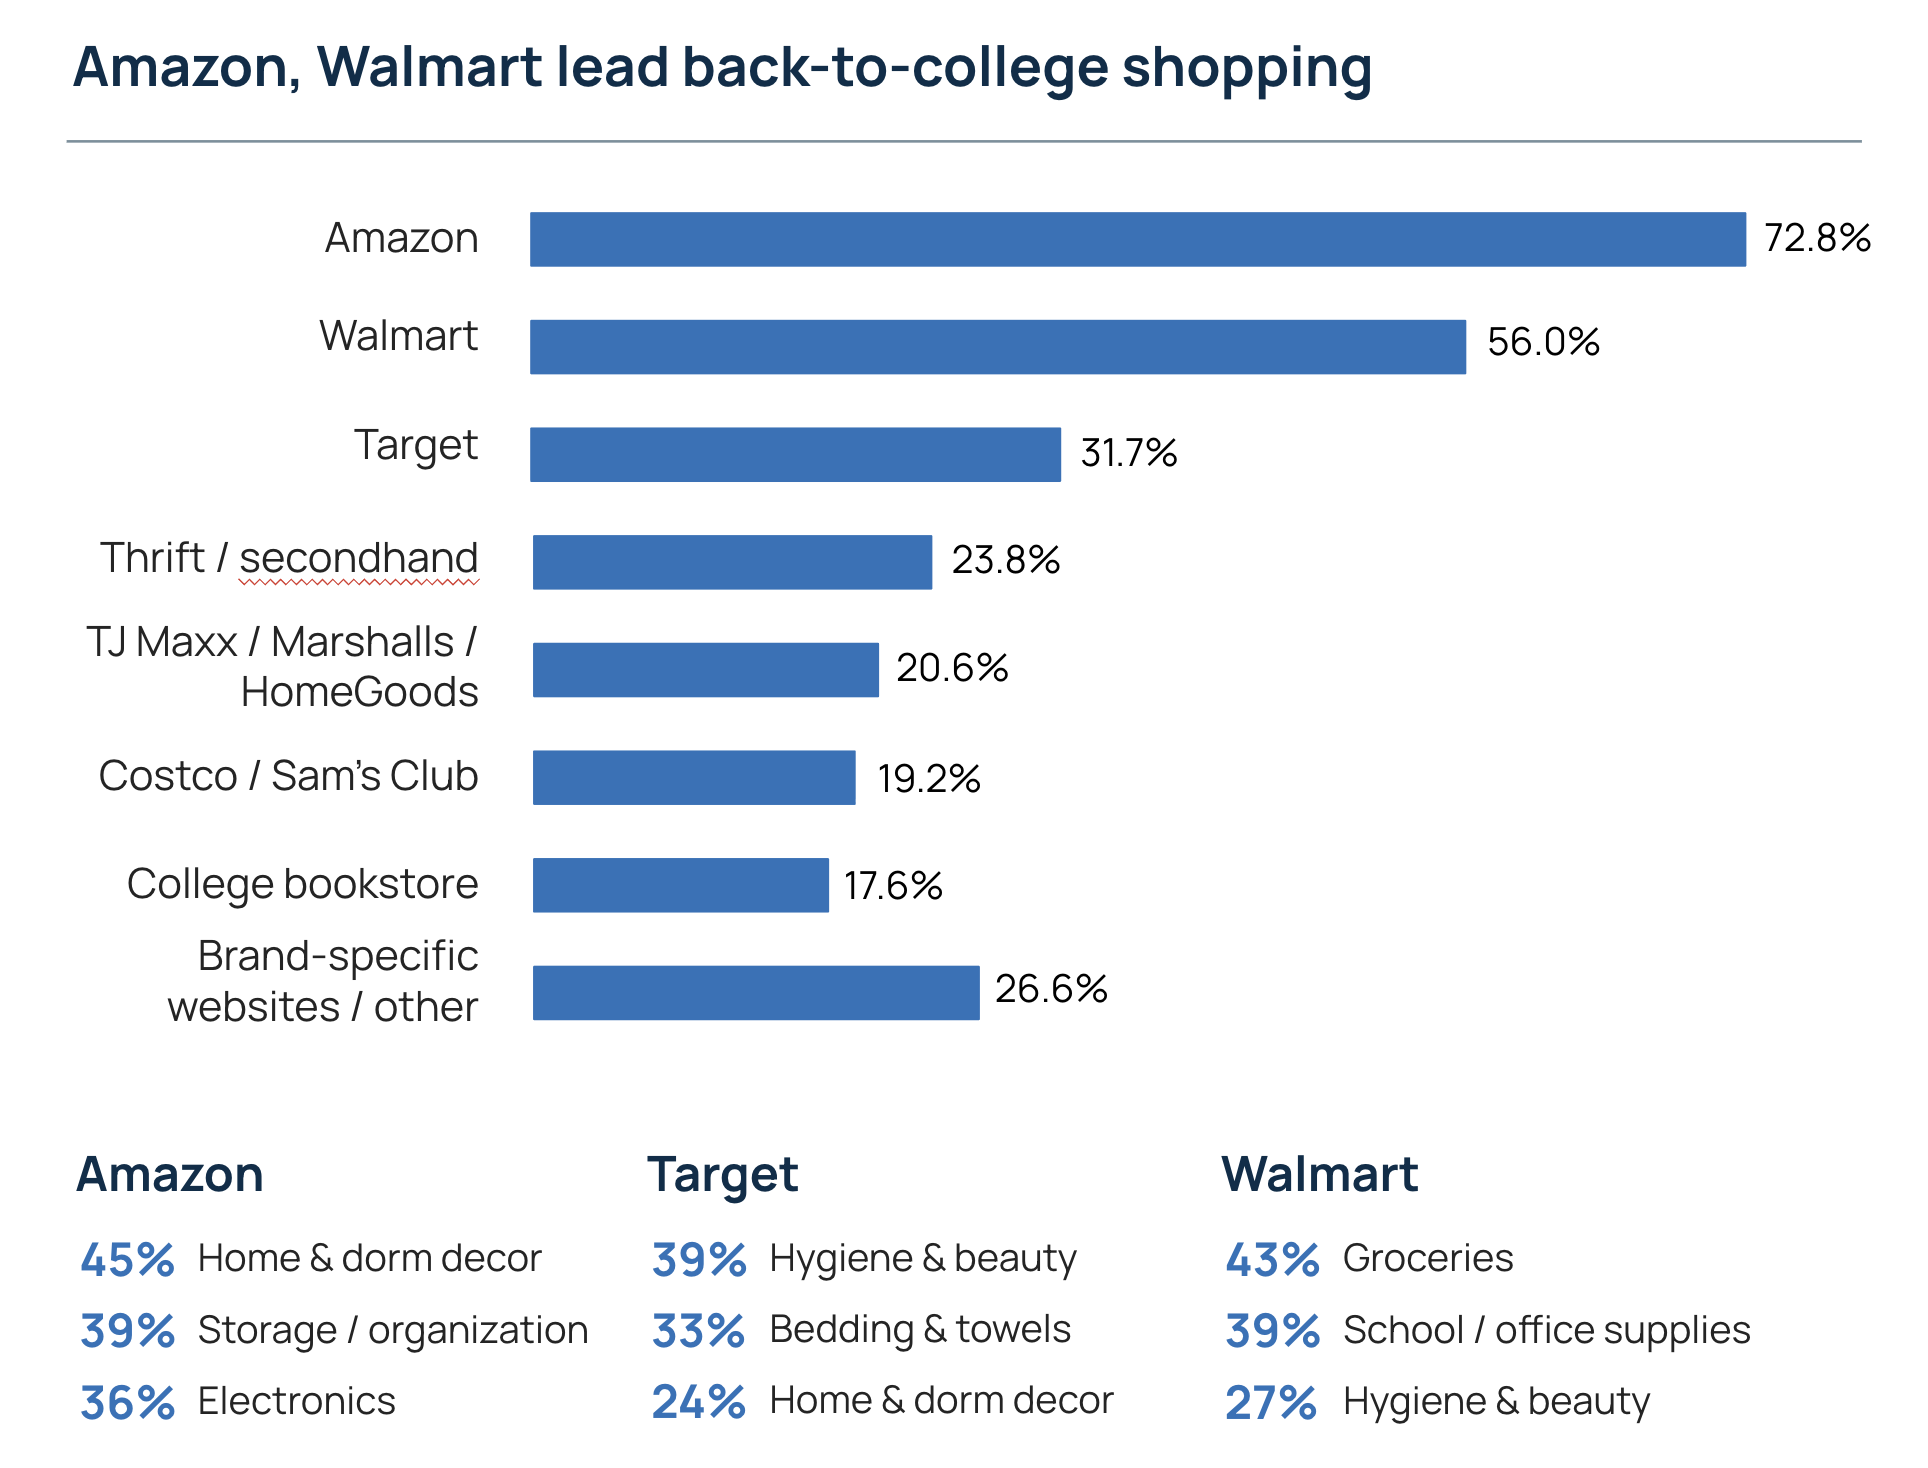
Bar chart titled "Amazon, Walmart lead back-to-college shopping," showing the share of students naming each retailer among their top back-to-college shopping destinations: Amazon 72.8%, Walmart 56.0%, Target 31.7%, brand-specific websites or other 26.6%, thrift or secondhand stores 23.8%, TJ Maxx, Marshalls, or HomeGoods 20.6%, Costco or Sam's Club 19.2%, and college bookstore 17.6%. Below the chart, a breakdown shows each retailer's top categories: Amazon leads in home and dorm décor (45%), storage and organization (39%), and electronics (36%); Target leads in hygiene and beauty (39%), bedding and towels (33%), and home and dorm décor (24%); Walmart leads in groceries (43%), school and office supplies (39%), and hygiene and beauty (27%).
source: flytedesk student research, 2026

Amazon's position at the top of the overall retailer ranking is real, but it understates how deliberately students route between stores by category, Amazon leads dorm décor and electronics, Target leads hygiene and bedding, and Walmart leads groceries and school supplies.

What drives student purchase decisions

Quality, cost, and aesthetics all factor into student purchases, but the weighting shifts significantly by category. Notably, groceries are the only category where more than 50% of students name cost as their primary driver.
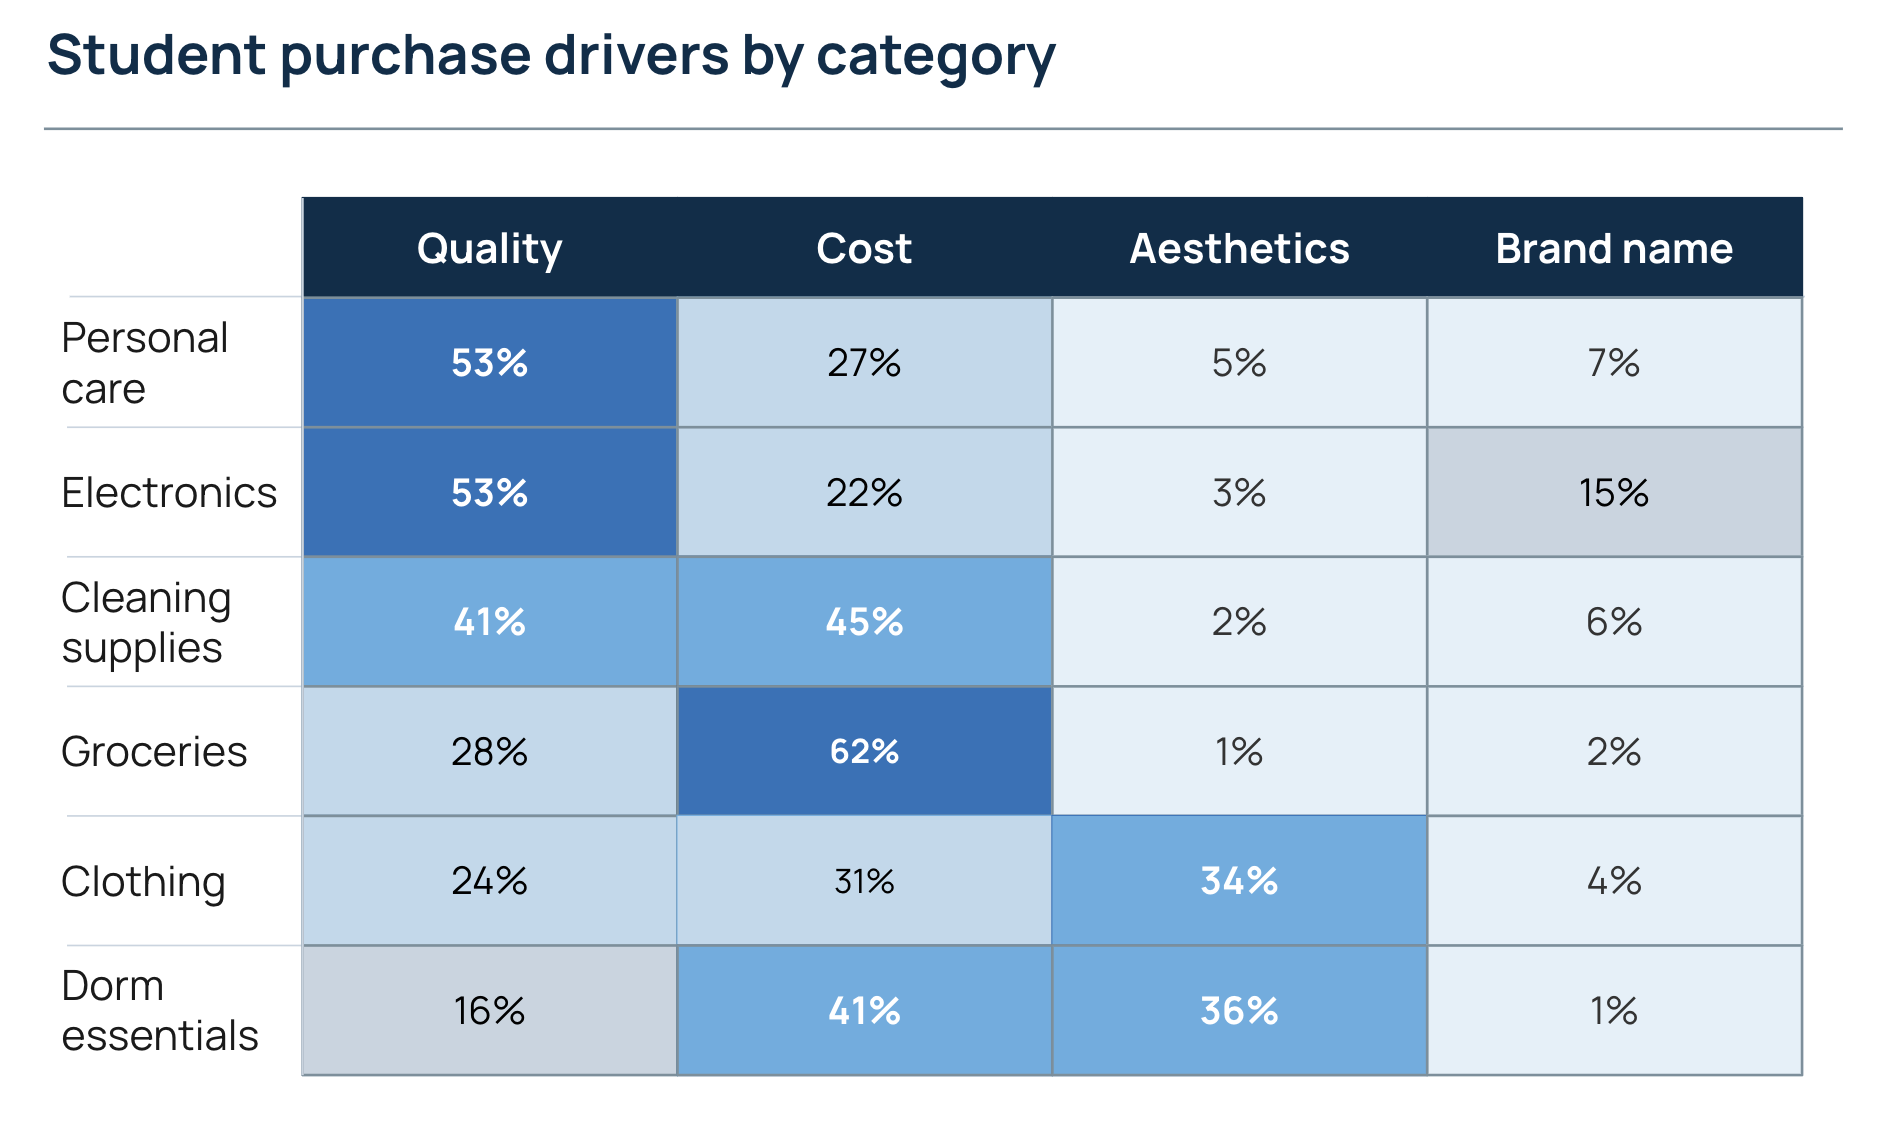
Table titled "Student purchase drivers by category," showing quality, cost, aesthetics, and brand name as a share of students naming each as their primary purchase driver. Personal care: quality 53%, cost 27%, aesthetics 5%, brand name 7%. Electronics: quality 53%, cost 22%, aesthetics 3%, brand name 15%. Cleaning supplies: quality 41%, cost 45%, aesthetics 2%, brand name 6%. Groceries: quality 28%, cost 62%, aesthetics 1%, brand name 2%. Clothing: quality 24%, cost 31%, aesthetics 34%, brand name 4%. Dorm essentials: quality 16%, cost 41%, aesthetics 36%, brand name 1%.
source: flytedesk student research, 2026

Brand name ranks last or near-last in every category, never breaking above 15%. But stated preference and actual behavior diverge here: flytedesk research finds that students are measurably more likely to buy the brands they believe their peers are using, a gap we'll explore in an upcoming article.

What this means for back-to-college campaigns

  1. Match the campaign to the buying window. Many of the highest-frequency categories get purchased after students arrive on campus. A campaign that ends in summer ends before that spending happens.
  2. Time activations to campus-specific academic calendars. Move-in dates and class starts vary by school. A single launch date can hit one campus at move-in and another weeks into the semester.
  3. Aim for campus saturation, not just student reach. A high-intensity media presence on fewer campuses will consistently outperform a moderate presence across a longer list, according to flytedesk research. Campaigns with four or more campus media channels showed 3x greater impact than those with a single campus media channel.

Want more insights like these? Get original college research, delivered to your inbox twice a month.

* indicates required

Have questions or want guidance?

Our team can help you apply these insights, explore additional resources, or workshop strategies for your campus campaigns.

Two people stand at a crosswalk in front of a campus transit bus wrapped in an Uber Eats ad offering $10 off 10 orders, with college-targeted copy and promo code college2023.